Take-off and landing in color
Data visualization in geographic research
In the year 2016, the airport Zurich transported more than 27 million passengers and dealt with more than 260.000 arriving and departing flights.
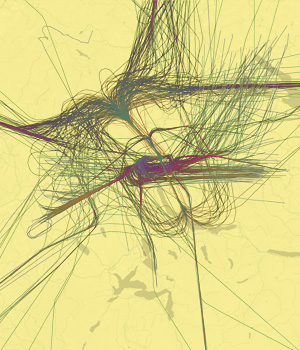
Our visualizations show aviation traffic arriving and departing at Zurich airport from March 2016 to July 2018. We colored the trajectories according to altitude above ground using a heatmap inspired colormap.
Blue represents an altitude of zero feet and yellow represents the maximum altitude of 40.000 feet. Zurich airport is clearly distinguishable by blueish colors in the center of the map. Furthermore, the strongly ruled general aviation routes and waiting areas become visible.
Geographic visualizations enable analysts to perceive emerging patterns and generate valuable insights. In this case, the aim of our research is to identify external movement influence factors such as time and weather and assess correlations with the observed movement behavior.
Dr. Halldór Janetzko is group leader and senior lecturer in the Institute of Geographic Information Visualization and Analysis at the University of Zurich. More
Related contributions